The principal obstacle to effective database marketing is the development of profitable strategies for use of the database. It is relatively easy to construct a workable marketing database. Many service bureaus are experienced at this work and can do a very satisfactory job. What the service bureau normally cannot help you with, however, is figuring out how to make your database pay off. These strategies you will have to work out yourself.
One of the oldest, and still one of the best techniques, is Recency, Frequency, Monetary (RFM) Analysis. Using this method, any marketer with a large customer database can almost guarantee profitable promotions to his customer base time after time after time. This article explains how to code your database for RFM, the theory underlying it, and some practical examples of how to make it actually pay off.
Why use RFM analysis? Why not use modeling based on demographics, or cluster coding? Why not use market research, or focus groups, or customer surveys? The answer is that all the components of RFM are behavioral: when the person purchased last, how often he or she purchased, and how much money has been spent. We are using these factors — which are readily available — to predict customer behavior. Predicting behavior based on recent behavior is a much more accurate and powerful method than predicting behavior based on any other known factor. Analysis in this article will demonstrate why this is so.
How to code your database
To do RFM analysis, all customer records must contain certain purchase history data, and be properly coded. This assumes, of course, that you have a customer database that can keep track of customer response. This is true of telephone companies, oil companies, retail stores which use a proprietary card, catalog mailers, insurance companies, travel and leisure, banks and many others: probably more than half of the database marketing situations.
In each customer record you must maintain three pieces of information:
a) the most recent date that the customer has requested a change in his service, purchased a discretionary item, etc.
b) a counter for the frequency – the number of times he has made a purchase, or continued his service with you. For a telephone company, for example, it might be the number of months of continuous service; for a retail store, it would be the total number of store visits. This counter is incremented by one every time a purchase is made.
c) a counter for the monetary amount – the total dollar amount the customer has purchased from you since the beginning of time.
Using these three pieces of data, we will construct our RFM codes.
Constructing a Recency Code
To create a recency code, you sort all the records in your database by most recent date, with the most recent at the top and the most ancient at the bottom. Once you have done this, you divide the database into five exactly equal parts (quintiles):
Figure 01 Building Recency Quintiles.

To the top group (your most recent) you assign and insert in each customer record the number 5. To the next group, a 4, etc. Everyone in your database then has a recency code of 5, 4, 3, 2, or 1. Don’t fall into the trap of determining the most recent group to be 0-3 months, the next 4 – 6 months, etc. This may sound like a good system at first, but it will cause problems later on. Stick with exactly equal quintiles, assigned by a computer program.
If you were to do a promotion to your customer base, you fill find a very interesting breakdown of responses by Recency Code. It will probably look something like this:
Figure 02 Response by Recency

Why is this so? Well, there are very few absolutes in marketing, but one of them is this: the people most likely to respond to a new offer are those people who have made a purchase from you most recently. There is something about people’s psychology that makes them more likely to open your envelope and act on what is inside if they have recently had a satisfactory transaction with you. This is true of retail stores, software houses, automobile companies, insurance firms. It is a universal phenomena. If you don’t believe it, you can test it yourself at very little cost. A program to insert recency codes into a database costs next to nothing if you already have a database. Any programmer can write it and run it in a half a day, even with a customer database that runs into the millions of records. Then, the next time you do a routine promotion, check the response by Recency Code. I would be amazed if you do not get a graph similar to the above.
Constructing a Frequency Code
You go about constructing a frequency code in exactly the same way. Sort your entire file from most frequent down to least frequent. Apply frequency codes to each quintile, so every record now has a frequency code of 5, 4, 3, 2, or 1. Put the frequency code in your customer records right next to the recency code. In effect, you have created a two digit code in every customer record, which varies from 55 (most recent and most frequent) down to 11 (most ancient and least frequent). Each group will have exactly the same number of records.
On your next promotion, do a graph of responses by frequency. You will be delighted to see a graph that will certainly look something like this:
Figure 03 Response by Frequency.

You will note that the difference in response between quintile 5 on frequency is not as great as the difference in the first and second recency quintiles. Why is that? Because recency is a more powerful predictor of customer response than frequency. In your business, that may not be true, but you will certainly be the exception to the general rule.
Constructing a Monetary Code
Construction of a monetary code is exactly the same as the previous two. Sort your entire file by dollars spent with the greatest dollar amounts at the top. Assign a 5 to the top quintile, 4 to the next, etc. If you measure your promotion response by monetary amount, you are very likely to get a response pattern that resembles this:
Figure 04 Response by Monetary Amount.

Put your monetary codes right next to the frequency codes. Everyone in your database will now have a three digit code in their customer record, from 555 down to 111. There are 125 RFM Cells in all. You should recalculate and revise your RFM cell codes every time that you update your database — typically once a month. Provide a space in your customer record for previous RFM cell so you can measure how people have moved during the past month. You may want to keep track of their RFM cell even earlier — six months ago, for example. It is up to you.
Now that you have the codes inserted, lets see what you can do with them. To illustrate their power, I am going to assume that you are in a position to make a promotional offer to your customers, and that your database is sufficiently large that you will want to do a test prior to the rollout. Let us assume, for example, that you do a test promotion to 40,000 customers. It doesn’t matter whether you are an insurance company, a credit card company, a cellular phone company or a retail chain. The principles are the same.
Your first step is to select your 40,000 customers from your database using an Nth. This is a computer program that automatically selects every Nth record for your test. To determine an Nth, you divide the number of records in your test group into the number of records in your database universe. If your have 800,000 in your customer database, dividing by 40,000 is 20. That means that you select every 20th record. You will pick the 1st, the 21st, the 41st, etc. When you do this, the 40,000 test will be an exact statistical replica of the main database — no matter in which order the main database had been sorted (alphabetical, by zip code, customer number, etc.). There will be an exact statistical sample of the RFM codes as well. There will be 125 different RFM cells, and each one will have exactly the same number of customers in it.
Let us assume that you make an offer to these 40,000 customers. Each business is different. For our example, let us assume that you offer something that costs about $120, and that the net variable profit from a successful sale is $35. The cost of the mailing (including creative, printing, personalization, and postage) is $0.62 per piece. Here is what the response to your offer might look like:
Response to 40,000 Test Mailing

These are only the first 20 cells. There are 125 in all. Lower cells usually have lower response rates. Those towards the bottom may have no response at all.
Why are all cells of exactly equal size? Why are not some slightly larger or smaller than other cells? Because of the method by which cells are created. Each quintile (R, F, and M) are exactly 20% of the entire file. It follows that each of the 125 cells will be exactly 1/125 of the entire file. If the coding is done correctly, there will be no larger or smaller cells.
Test Results
Lets assume that overall, your promotion had the following response:
| Number Mailed | Number | Cost/Each | Cost/Revenue |
| 40,000 | $0.62 | $24,800 | |
| Number Responded | 711 | $35.00 | $24,885 |
| Response Rate | 1.78% | ||
| Net Profit from Promotion | $85 | ||
These results came from a retail customer file. The promoted item was an article of men’s and women’s apparel which sold for about $125. Most people would consider this promotion a failure. We have spent almost $25,000 on a mailing, and netted a profit of only $85 after all expenses have been paid. That certainly does not cover our time spent planning the promotion, even if it does cover the mailing costs. However, we have learned something very valuable from this unsuccessful promotion. We have learned the response rate by each RFM cell. This is worth a great deal.
The basic theory behind RFM analysis is that the best predictor of future behavior is past and present behavior. It is certainly better than demographics, psychographics, geographics, or any other measure you can name. Since the RFM cells selected for the test are identical to the RFM cells in the entire database, we can safely assume that these unmailed customers will respond in the same way if given the same offer. Since we know whether a given cell will respond or not, we can suppress the promotion to the unprofitable cells, and concentrate on the profitable cells. Which are the profitable cells?
How to determine profitable RFM Cells
The profitable cells are those whose response is greater than break even. There is a simple formula to calculate break even. It is this:
Break Even = Mail Cost per piece / Net revenue per sale
In the above example, the mail cost was $0.62 and the net revenue per sale was $35.00. Therefore the break even response rate is:
Break Even = $0.62 / $35 = 1.77%
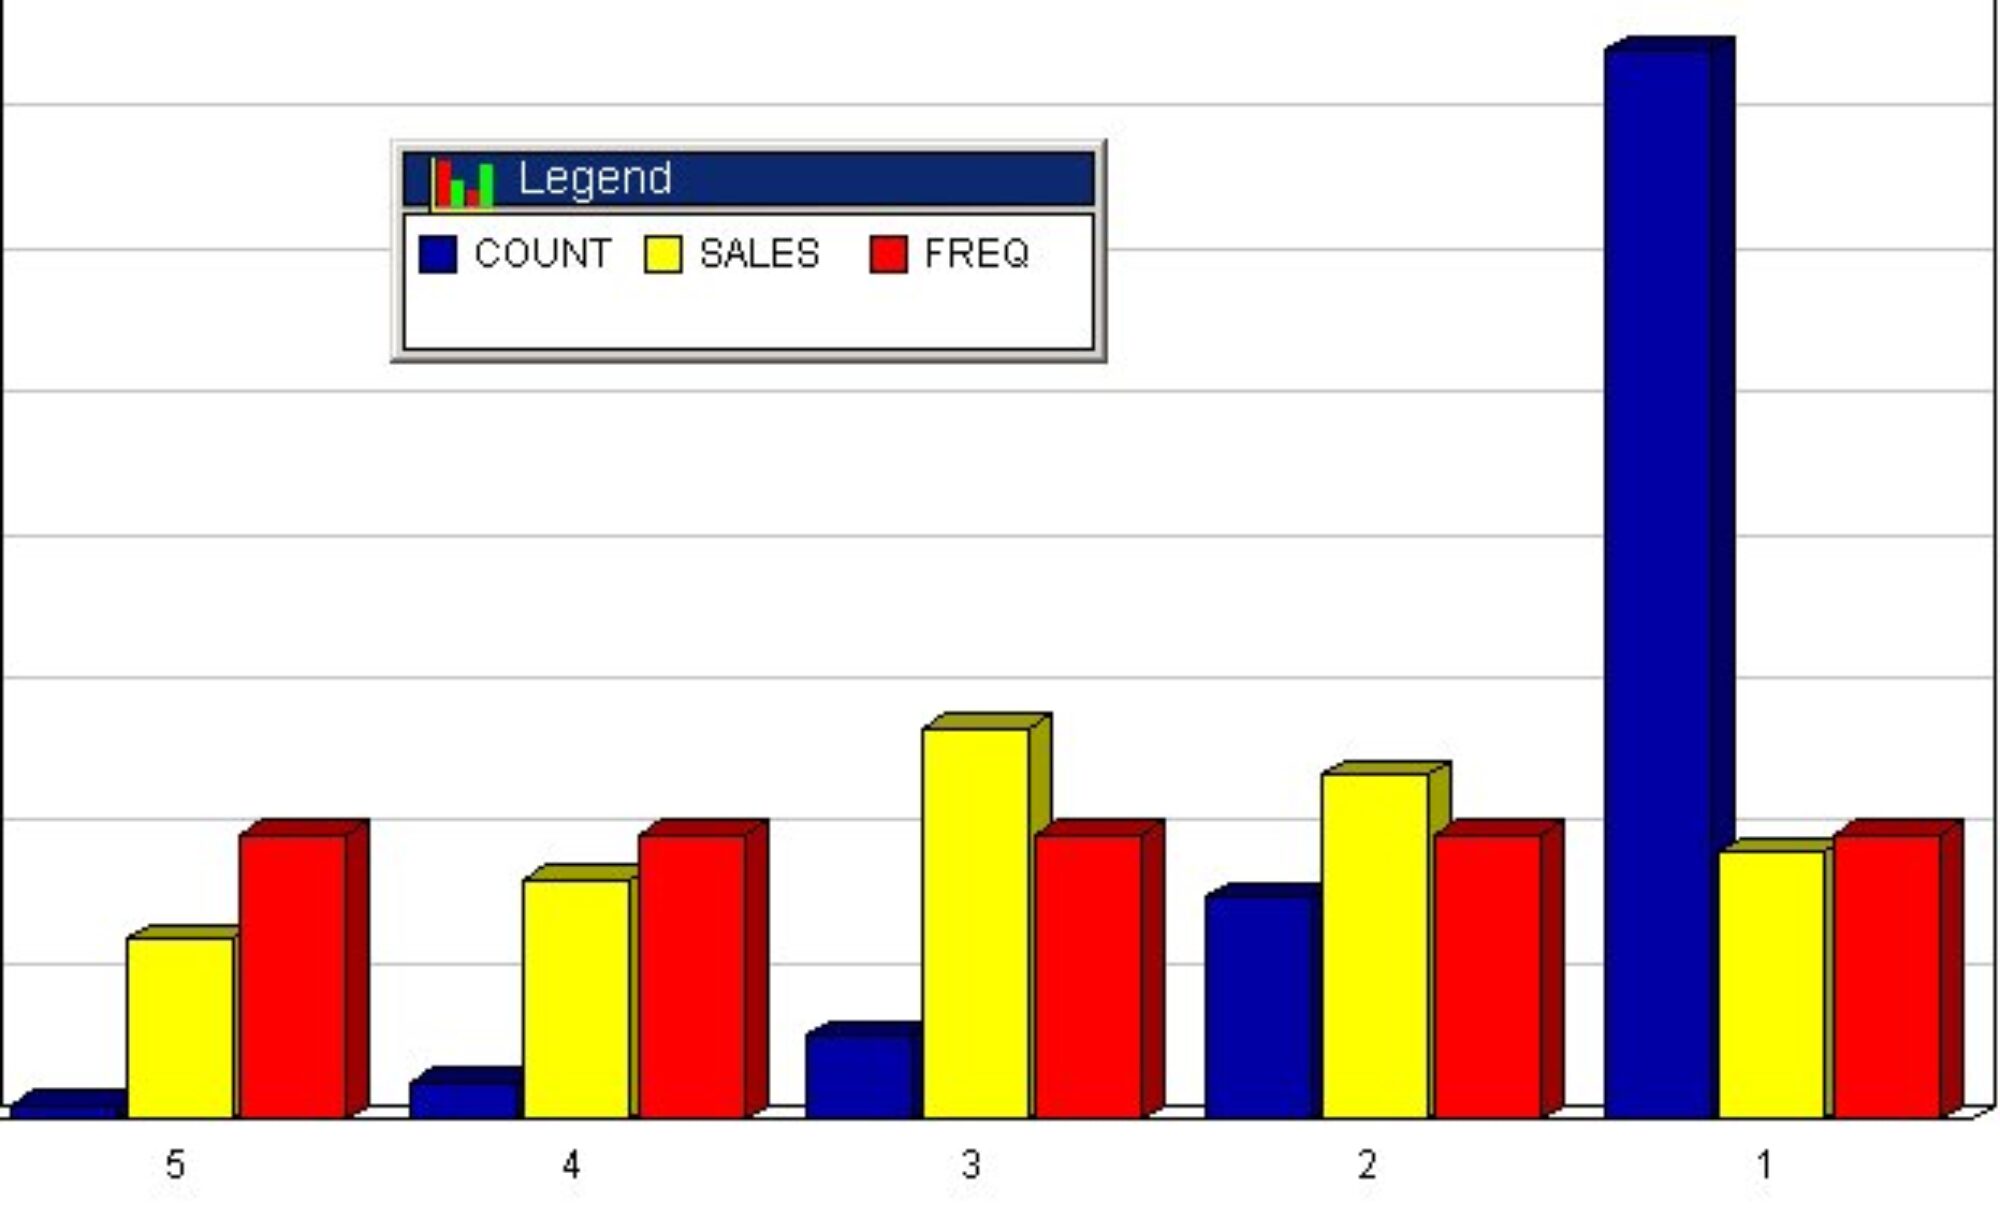
Any RFM cell that has a predicted response rate of 1.77% or better should be promoted. The balance should be dropped. Here is a graph of the profitable and unprofitable cells:
Figure 5 Response by RFM Cell

Data for this chart was prepared by dividing the response rate by the break even rate, multiplying by 100, and subtracting 100. Break even rates, therefore, are shown as zero. This is an index of profitability. Any cell with a score above 0 will be profitable, all those below will be unprofitable.
Knowing this predicted profitability, it is a simple matter to make a profit from a rollout promotion: mail only the profitable cells. There one preliminary step, however, that will insure success. You must discount the test results.
It is well known in direct marketing that the test always does better than the rollout. What this means is that if you get a 2% response rate to a test, you will get less than 2% when you mail your entire file. Why is this? You will hear many explanations, but mine is this: marketers simply cannot stand to have an unsuccessful test. They will always take steps to make sure that the test has a high response rate. They assume that if their test does not work out, their reputation will suffer. So they pick the best lists, the best time of year, the best offer — in many cases things that they cannot replicate in a rollout promotion.
In this case, we cannot fudge the list, since we have used an Nth. But there are subtle things that will creep in to prejudice the test results. For this reason, I recommend that you discount your test results by 15% in determining the RFM cell response in a rollout. You may use 25% or some other number. This means that if you got a 2.0% response rate in some RFM cell in the test, you should assume that you will get only a 1.7% (2.0 x 0.85) response by that same cell in the larger mailing.
Using these discounted test response rates, you should then promote only those cells which score higher than break even. The results can be quite startling.
Test Rollout Selected
Rollout
| Mailed | 40,000 | 800,000 | 211,200 |
| Responded | 711 | 12,104 | 7,293 |
| Response Rate | 1.78% | 1.51% | 3.45% |
| Mail Cost | $24,800 | $496,000 | $130,944 |
| Net Sales | $24,885 | $423,640 | $255,255 |
| Net Profit | $85 | ($72,360) | $124,311 |
What this chart shows is that if the entire database had been promoted, the response rate would have been 1.51% (that is 85% of the test rate of 1.78%). You would have sold 12,104 items at a net profit of $35 per sale. This would bring in $423,640. But your total promotion would have lost $72,360, after subtracting your mailing cost of $496,000.
Using the discounted test results, you find that there are only 211,200 customers that fall in profitable RFM cells — cells whose discounted response rate is 1.77% or higher. The discounted response rate is determined by discounting the test results from each RFM cell by 15%. Mailing only these 211,200, you get only 7,293 sales for a net revenue of $255,255. Since your mailing costs are only $130,944, your net profit on the entire project is $124,311.
Is this a fluke? No, it is normal RFM analysis. It will always work, if you have the data necessary to construct valid RFM cells, and if you follow the methods rigorously. You can turn almost any valid test into a profitable rollout.
How Big a Test
One question always comes up. How large (or small) can your test be to be valid. One basic rule is that the expected responses should be 500 or greater. To know how large that is, you have to have some idea as to the size of the expected response. If you normally get a 5% response from your customers, then to produce 500 responses you only have to test 10,000 customers.
What is magic about 500? The answer lies in the fact that there are 125 RFM cells. Five hundred responses means that the average RFM cell will have four responders (500/125). When the average cell response is less than four, the law of chance becomes more important in your results than the law of customer behavior. Of course, the larger your test is, the more accurate will be your results. A test of 40,000 will be more accurate than a test of 30,000. It will also cost more. Will the extra cost of the 10,000 be worth it in terms of accuracy in rollout selection? You will have to make that decision yourself based on your situation. You will have to experiment over time to learn the ideal test size for your customer database.
Some Exceptions
As can be seen from the analysis, RFM only works with a customer database — and only with customer databases that contain the necessary data. It is of no use with a prospect database. If your customer database has only part of the data needed (for example has recency and frequency, but lacks the dollar amounts) you can probably still get some benefits out of trying the technique.
Determining recency can be a problem. With an electric utility, telephone company, newspaper, or insurance company, for example, customers often receive monthly statements and have to pay their bills every month. If last bill paid were used for recency, every current customer would be in the top quintile which would make it useless. In this situation, for most recent date, you should use the last time that they changed their service, or last time they called customer service or some other similar date. The idea is to get the last time that they thought about your company and did something. At such times, your company has been logged in to their conscious memory.
Cell Personality
We have illustrated RFM by assuming that you were going to do a direct promotion using either mail or telemarketing. There are many other uses. If, for example, you have decided to create special customer segments which will get special treatment (gold card holders, for example) RFM is an ideal way to find out who should go into your top category.
Each RFM cell has a personality of its own. All new customers, for example, enter as 511’s. They are the most recent, but usually the least frequent and have the lowest dollar amount. After they enter, they can either move up or down, based on their subsequent behavior. It is a good idea to track where people were last month. You can set goals for each cell, to get new customers to advance in their second month from a 511 to a 512, for example, rather than moving down to a 411.
The lowest group, 111’s may not be customers at all. You may want to archive the lowest cells, taking them off your database, after trying a reactivation mailing on them. To keep them on your database year after year can just waste your money, and their time. Don’t drop your 155’s without a struggle, however. These are great people on whom you should lavish special attention.
Maintaining Contact
If you use RFM cells as a basis for all of your customer contact, you will lose touch entirely with some of your customers — the ones below the break even point on your tests. This may be good, or bad. After all, the purpose of building a relationship with customers is to build profits, not just to be nice. This is not a democracy, it is a business. Eighty percent of your revenue usually comes from the top 20% of your customers — those with a 5 in Monetary. Discrimination is good for business — and will also be accepted, or welcomed by your customers. Why welcomed? Because some people just don’t want to be bothered by their suppliers all the time. A 111 may be trying to tell you something: “Leave me alone, please.” Both parties may profit by a parting of the ways.
Influencing Behavior
Does RFM analysis influence customer behavior? Not really. We are simply using RFM as a method of segmenting our customer file based on recorded behavior from the past, and using this segmentation method to predict the future. Customer behavior will be influenced more by the communications that are generated in the process of using RFM analysis. For example, we may direct a reactivation mailing at people whose recency quintile is a 1. We may send a welcome letter to new customers, and encourage them to refer new customers to us. We may tell customers in high RFM cells that they have achieved “Gold” status which provides certain benefits to them. We can describe the benefits of “Platinum” status which requires only a little more effort on their part. So RFM does not influence behavior by itself, it just helps us to target behavioral promotion efforts.