
So you’ve made the decision to try statistical segmentation or modeling against your traditional RFM. To cut through all of the hype, you vow to carefully test the new method against the old. But we’re not talking about an A/B split of one list, or measuring one rental against another. You will be comparing two different approaches to your customers. So what is the best way to make this comparison?
The first point is not to get too fine in your mailings. You won’t find anything out about customers you don’t mail. Use a mailing where you would ordinarily go pretty far down into your RFM schema. You also want to mail pretty far into the model. Even without mailing every cell, you might want to take a few thousand from even the lowest cells just to see what would have happened. Again, you don’t want to bet the farm, but if you are mailing most of your customers anyway, then the negative risk is minimal.
The key in the comparison is to find a method which isn’t too cumbersome, is easy to understand and perhaps most important is fair to both techniques. Both RFM and segmentation models attempt to predictively rank customers from good to bad. We need to keep not only the results but their interpretation in mind as we compare. There are three common approaches: random allocation, unique comparison and ID match.
Random allocation involves matching the customers selected by RFM with the customers selected by the model. Two tapes are created, many names happen to be common. Using an exact match (the names came from exactly the same source) the two tapes are compared at your service bureau. The matching names are then randomly reallocated first to one tape, then the next match to the other tape. In this way, each segment retains its original key code. Unfortunately, the segments with the most matches lose some of their original count. At the same time, it is fair to both techniques. Assuming both tapes had about the same total number of names, each had the same number of matches, therefore, we can simply compare total sales and profit and see which technique did the best.
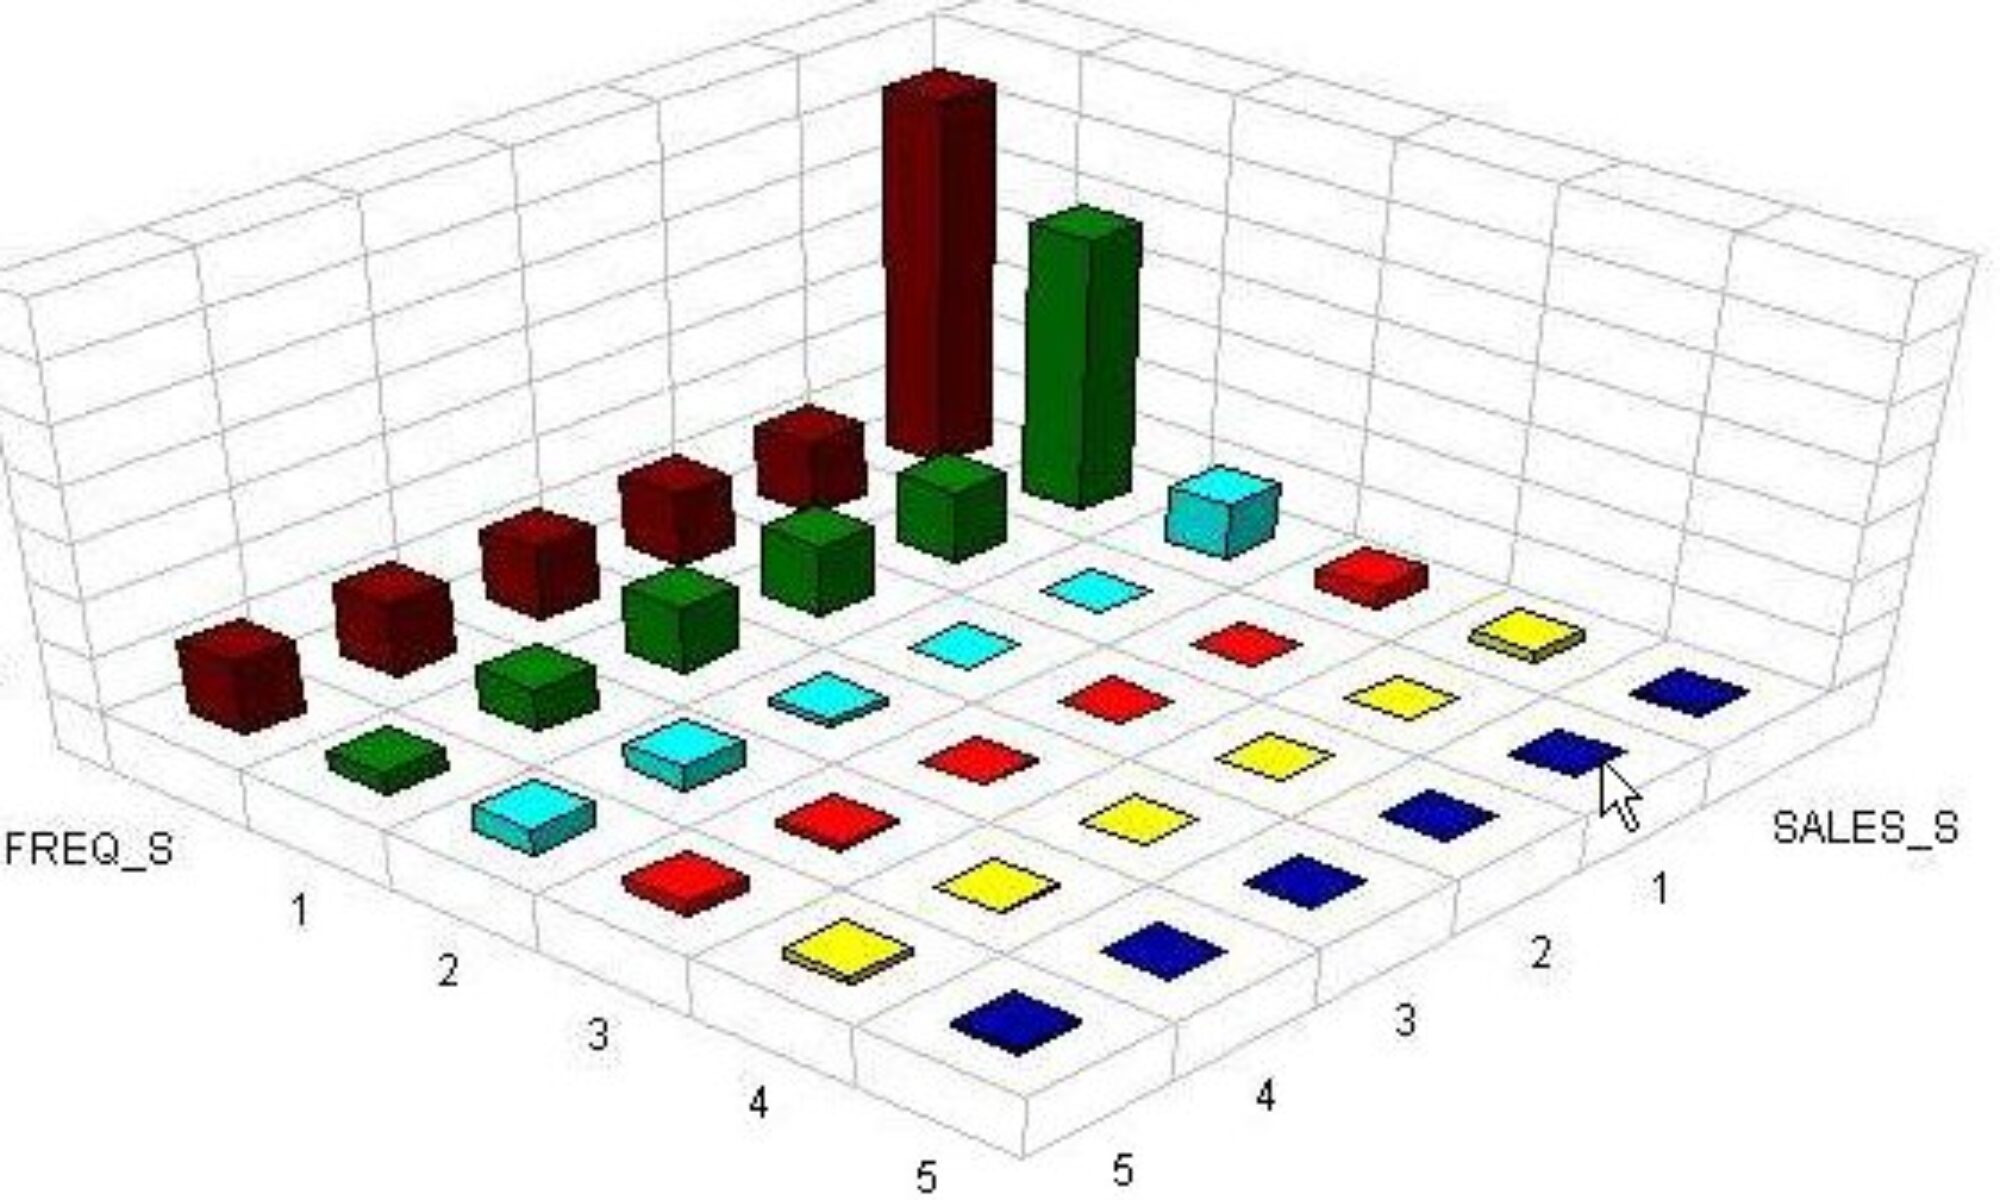
This method preserves the complete original key coding of both tapes. If you don’t have equal quantities you can still easily compare the two results. Assuming you have an expected rank of your RFM cells, it is a good idea to line up results with quantities as the X axis and sales or profit on the Y axis. This graph illustrates the dramatic difference between RFM and modeling results.
Compare Uniques is probably the easiest both to do and to understand. Simply match the two tapes, preserve the RFM key codes for the matched names. Key the unique names of each tape separately. The assumption is that if the new technique finds names RFM would have missed and the names do better, then the model will more than pay for itself. Mailers who care mostly about “beating control” focus on this most common method. In a recent test, our model uniques generated $15 sales per catalog, the RFM uniques generated $1 per book. A great win “right?”
This technique separates the unique names from their original segments. Little insight is gained by the comparison. Further, to the extent that RFM is usually pretty good at finding the best names, there might not be much difference at the top end. The uniques that are compared often lie far down into the moderate or poor customers. Bottom line, this technique tends to destroy analysis of the results. This overly simplistic comparison reduces the subtleties of both RFM and statistical segmentation to a horse race. A few months ago, a client may have manipulated this comparison by first selecting all the 24 month buyers, then they required selection of modeled names far down into the poorer names. The net effect was to force a comparison between their unique RFM names the model missed with the forced uniques way down in the heap.

ID Match requires some computer processing to understand what happened in the mail. Two tapes are created. Customer ID’s and key codes are preserved. When orders come in, they are matched back to each tape. In this way, results actually recreate how both mailings would have done. Most importantly, this technique perfectly preserves both customer rankings and cell counts. Assuming we again compare sales and profit as mail quantities increase, we can lay both techniques side by side as seen in the graph above.
Conclusion
If you are planning to spend the money to tip toe into modeling, make sure you also take the time to plan your testing and evaluation techniques. Comparing uniques might be the most common way to assess payback, but the other two provide a much richer picture of what is really going on in your customer file. Good luck